Twitter Streaming Graph with Gephi
Visualising stream of Data
- Track: Graph devroom
- Room: H.2214
- Day: Saturday
- Start: 12:30
- End: 13:00
Presentation of the original vision of the Twitter Stream Importer, from start to current situation with "experience feedback". If possible showing a demo real-time and "open discussion" about improvement on going, visualisation usage etc...
Since some years now, the particularity of Twitter is to be "reactive" or real time compare to other Social Network.
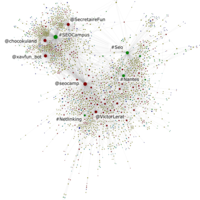
The massive stream of data generated by some events (going from Tv shows to more serious event) can't be digested with traditional tools (Twittdeck etc...). The visual representation of a twitter activity could help to reveal insights on a running topic. Graph allows to contextualize and visualise the interaction between users and thematic within this topic.
To do that, the Twitter Stream Importer brings tools to start tracking a topic and visualise data with different "Network logic" that act like a particular projection of the data. The integration within Gephi then, makes easy to use the integrated tools (statistics, filter, exports) to works easily on you subject.
We will see what are the main concept, what are the pro and cons and the following evolution of the plugin.
Speakers
| Matthieu Totet |