Scaling Mobility Flow Visualization: Origin-Destination Data with DuckDB, Flowmap.gl, and SQLRooms
- Track: Railways and Open Transport
- Room: K.3.601
- Day: Saturday
- Start (UTC+1): 17:35
- End (UTC+1): 17:55
- Chat: Join the conversation!
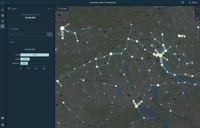
Visualizing origin-destination (OD) mobility data—commuter flows, transit ridership, freight traffic—is essential for transport planning, but datasets can contain millions of flows that overwhelm traditional mapping approaches. In this talk, I'll present open-source tools for preparing and visualizing large-scale OD data interactively in the browser.
I'll introduce flowmap.gl, a WebGL-based flow map layer for deck.gl that renders geographic movements with adaptive clustering and filtering. To handle large datasets, I'll demonstrate sqlrooms-flowmap, a Python tool that uses DuckDB with spatial extensions to prepare OD data for tiled serving:
- Hierarchical clustering: locations are grouped at each zoom level using pixel-radius clustering, creating a hierarchy where clusters merge as users zoom out
- Nested Hilbert indexing: OD pairs are indexed using a space-filling curve that preserves locality, enabling efficient range queries for tile-based serving
- Spatio-temporal aggregation: flows are aggregated to match zoom-based clustering, with optional temporal bucketing by hour/day/week
The prepared data can be visualized using a demo app built with SQLRooms, a browser-based analytics framework powered by DuckDB, where users can query and explore flows using SQL alongside interactive maps.
I'll show a live demo using Switzerland's National Passenger Transport Model (NPVM)—an open dataset of passenger flows across the Swiss transport network—demonstrating the full pipeline from raw data to interactive visualization, all using open-source tools that can run locally without cloud dependencies.
Speakers
| Ilya Boyandin |